Unified Quality Dashboard (UQD)
To access UQD, log in to Console Dashboard with your TechPass and then select Unified Quality Dashboard (UQD).
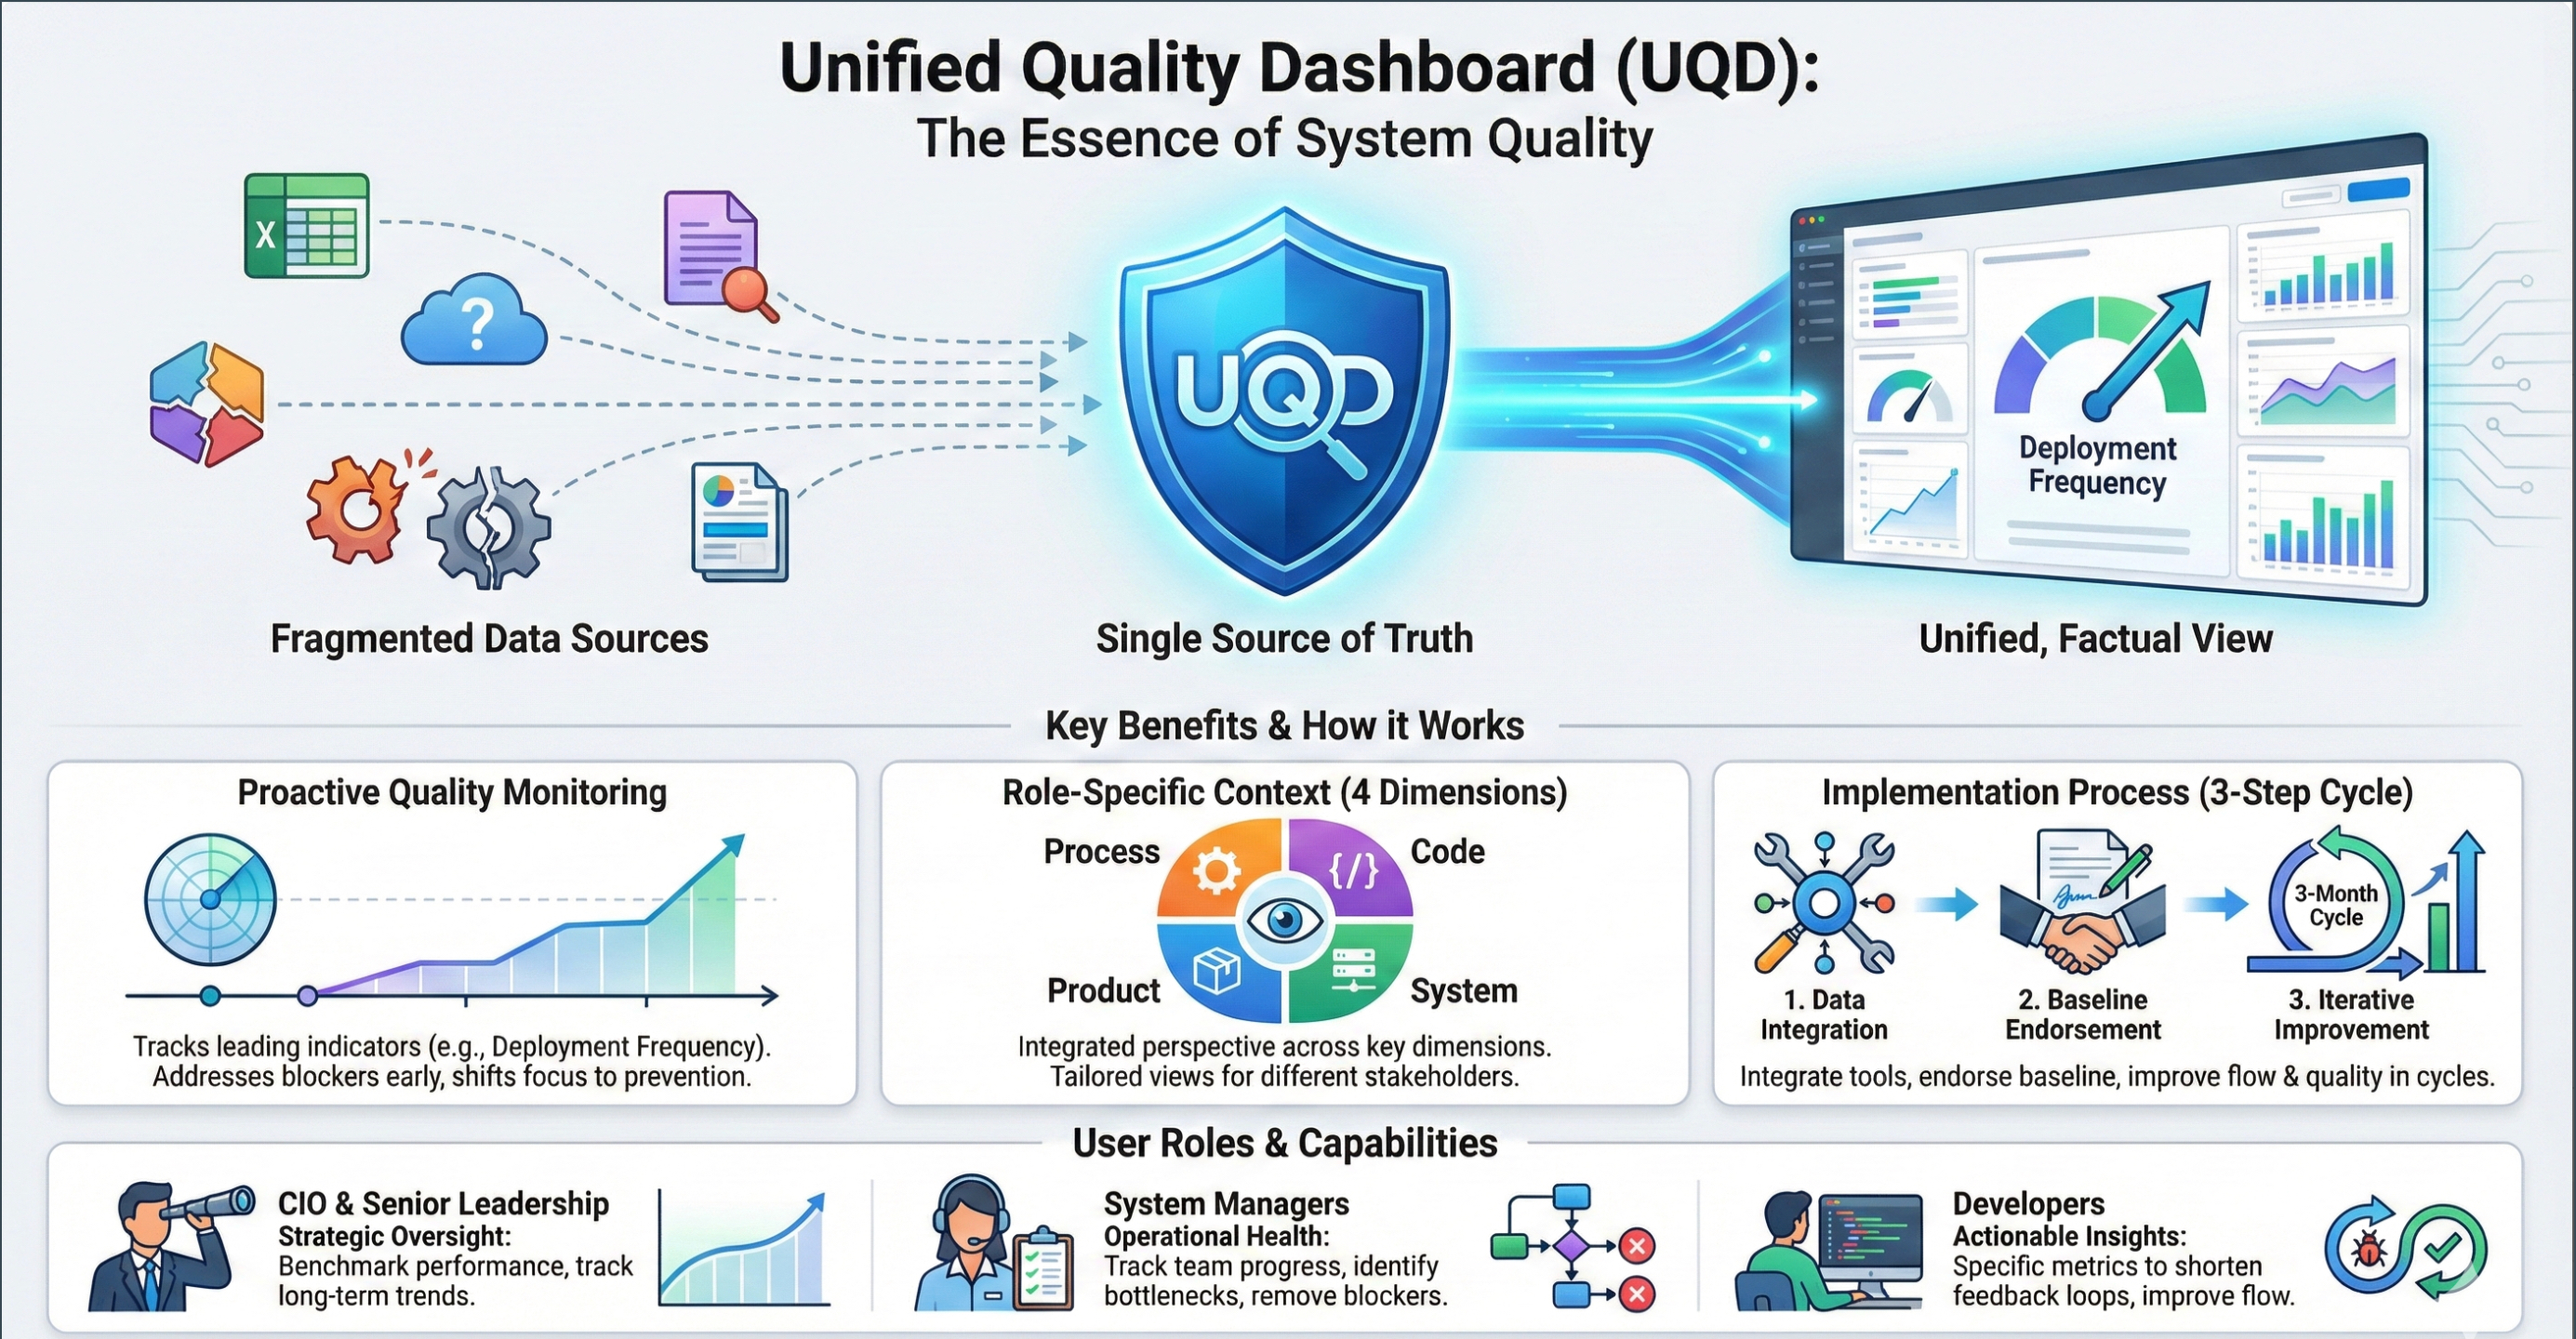
The Unified Quality Dashboard (UQD) provides a single, consistent view of system quality by bringing together data from tools such as GitLab, Jira and monitoring platforms. It removes the need to interpret fragmented reports from different systems and replaces them with clear, actionable metrics.
Its purpose is to transform fragmented data into clear, actionable system health metrics, shifting an agency from reacting to problems toward being proactive about quality and innovation.
Its primary focus is Deployment Frequency, which acts as the main indicator of delivery agility and system maturity.
UQD helps agencies move from a reactive posture to a proactive, data-driven approach to improving quality, reliability, and delivery speed.
It supports data-driven decision-making and helps agencies measure and improve agility over time.
Benefits of UQD
The UQD provides a unified, factual view of system quality, helping agencies improve agility, alignment, and decision-making. Key benefits include:
Single source of truth: Consolidates fragmented data from multiple systems into one reliable view.
Aligned understanding: Offers role-based perspectives for CIOs, system managers, and developers, ensuring consistent interpretation of quality metrics.
Proactive quality monitoring: Surfaces leading indicators, such as Deployment Frequency, to help teams identify risks early and act before issues escalate.
Accelerated delivery: Real-time insights shorten improvement cycles, speeding up fixes and upgrades by an estimated 30%.
Increased efficiency: Removes the need for manual data collection and verification, reducing administrative effort by about 40%.
Innovation and agility: Supports more frequent, stable releases and strengthens an agency’s ability to deliver new features rapidly.
Strategic clarity: Creates a shared baseline and common language for quality, improving strategic focus across leadership and delivery teams.
Resource optimisation: Reduces reporting overhead so teams can focus on higher-value work and innovation.
Consistent framework: Standardises definitions of quality across four dimensions—Process, Code, System, and Product—to enable fair comparison and consistent assessment.
Continuous improvement: Helps teams measure progress against an endorsed baseline, enabling predictable, structured improvement cycles.
Key metrics included
North Star Metric
- Deployment Frequency — the core indicator of delivery agility.
Supporting developer & system metrics
- Lead Time for Changes
- Time to Restore
- Change Failure Rate
- PR Cycle Time
- Work in Progress (WIP)
- Code Quality signals (vulnerabilities, code smells, technical debt, test coverage)
- System Health signals (uptime, latency, error rates)
Metrics are grouped into four quality dimensions: Process, Code, System, and Product.
How UQD works
Data integration
UQD connects to GitLab, Jira, SonarQube, monitoring systems, and internal tools to establish automated data flow.Standard quality framework
All metrics are categorised into consistent dimensions to provide a unified understanding of system health.Baseline endorsement
A CIO or system owner endorses the initial baseline, marking the start of the improvement journey.Consolidated view UQD provides a consolidated view of key metrics that different stakeholders can interpret according to their needs. For example:
- CIOs and senior leadership: Can review strategic trends and long-term quality improvements.
- System managers: Can monitor operational bottlenecks and team progress.
- Developers: Can identify actionable insights to improve flow, code quality, and reliability.
Continuous improvement cycle
Teams aim for measurable improvements—usually within a 3-month cycle—based on the North Star and driver metrics.
Best practices for UQD
- Start with the problem: Identify the reporting gaps or visibility issues the dashboard should solve.
- Align on a north star metric: Use Deployment Frequency to anchor discussions and decisions.
- Pilot before scaling: Onboard pilot teams, validate metrics, and refine definitions before full rollout.
- Track leading indicators: Prioritise actionable, predictive metrics over lagging signals.
- Adopt a regular review cycle: Use a fixed improvement cycle (e.g., 3 months) to measure progress consistently.
- Inspect data quality: Validate integrations and metrics regularly to maintain trust.
- Encourage feedback: Use the Slack community - cep-uqd-customers or the feedback form at
go.gov.sg/uqdfeedback.
UQD views
UQD provides different dashboard views depending on the type of insight required.
- Operational view – monitors delivery outcomes and deployment cadence across systems.
- Diagnostic view – investigates development workflow, pipeline performance, and delivery flow signals.