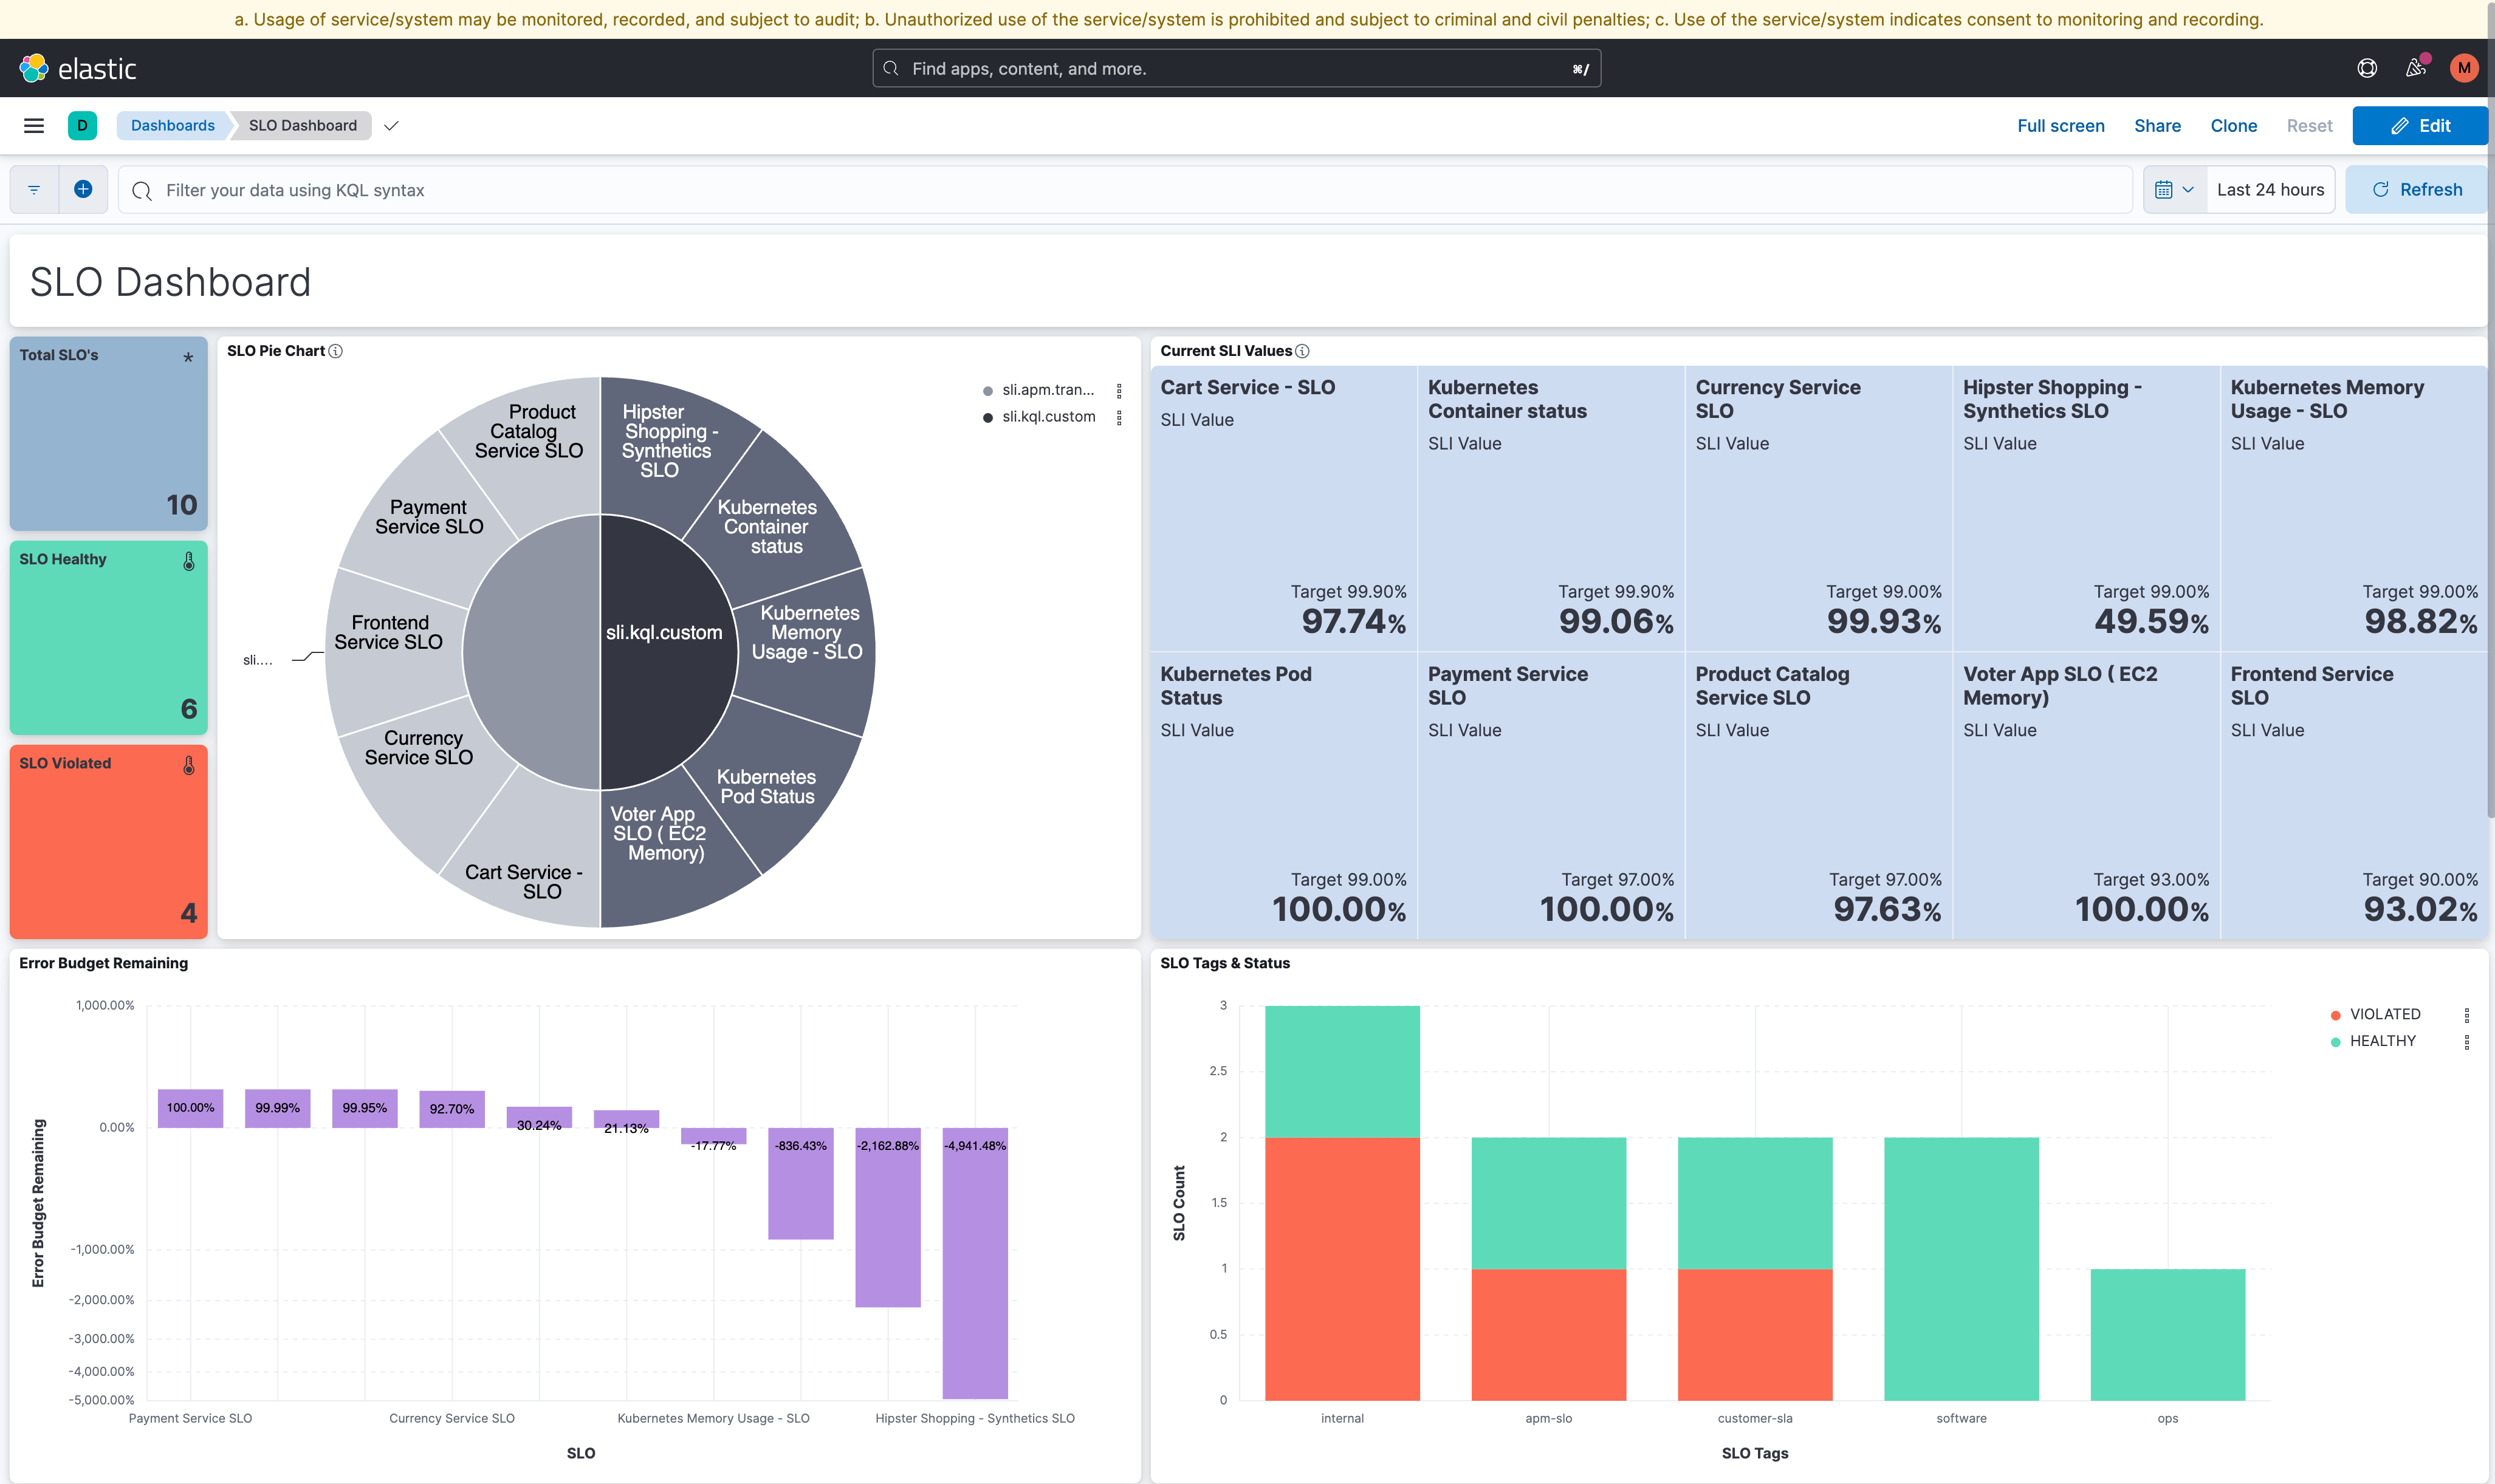
SLOs on StackOps Elastic
In StackOps, you can define SLOs based on different data sources like custom Kibana Query Language (KQL) queries and APM latency or availability data.
Then, you can monitor your SLOs in real time using Kibana dashboards and alerts that help you quickly identify and troubleshoot any potential issues. You can also get other insights like real-time progress against SLO targets and clear views of error budgets and burn rates.
SLO dashboard
SLO dashboards consolidate and visualise different kinds of SLO related information, which provide a holistic view on the SLOs and their statuses in your StackOps Elastic deployments. The panels shows details such SLI value, Error Budget, SLO tags and many more.
You can download the dashboard JSON file from StackOps Innersource repo and import it to your deployment.