Q&A from learning events
This is a comprehensive collection of questions and answers from various webinars, workshops, and training sessions.
10 October 2025 - From TechBiz to Console: A New Central Platform for StackOps
Yes, we are in the midst of working with TechPass to include that functionality as well.
No, the deployment URL (Kibana) can be accessed from Seed/COMET/GSIB devices. In order to send logs and metrics from your workload, you need to whitelist the VPCE endpoint and this can be done using traffic filters in Console (self-service), with no need to raise an SR to the StackOps team.
Refer to the documentation to create the VPCE and Azure Private endpoints to send logs and metrics privately.
The current pricing includes a 7% discount off Elastic usage costs for 1 year. We are reviewing the pricing for FY26. On the other hand, if you are onboarded to StackOps Elastic, we would suggest you do cost optimisation as we did for our tenants, which resulted in 30-60% cost savings for them.
No, there is no additional action required. Your deployment/subscription will be seamlessly consolidated as well.
If you have already created your DGP ID, you can select your ID after filtering your Agency and selecting the DGP subsystem. If you have not created it before, you would need to approach your assigned DGP Agency Contributor. More information can be found in the link accessible only via GSIB: https://ssp.dgp.tech.gov.sg/Faq. Tagging of the DGP ID is optional if your DGP ID has not been created yet.
Console will be meant for users and developers as well. Inviting users to TechPass can also be done by Public Officers.
You can find the API documentation at: https://docs.developer.tech.gov.sg/docs/stackops-apis/
You can choose the spaces when creating custom roles.
Console API keys will give you access to using the RBAC keys. Kibana API keys will give you access to use Kibana APIs.
We are still working with the rest of the product teams on how we can bring all of the GovTech services together. It requires a lot of alignment and discussion, but rest assured that we are going for the same idea.
11 July 2025 - StackOps 101/102
- The default Elastic LLM connector is disabled as it uses a U.S.-based model
- Data sensitivity assessment is the responsibility of individual tenants
Security scanning or assessment is notrequired before deployment. Teams can begin using SOA (StackOps Automation) immediately. Several agencies are already actively using the tool.
Regarding AWS access permissions:
SOA has permissions beyond read-only access It can create Virtual Private Cloud Endpoints (VPCE) It can provision EC2 instances to run the Elastic Agent These capabilities are necessary for proper deployment and operation
You can self-service connection whitelisting with Traffic Filter management.
App monitoring workshop 102
Currently, Elastic File System integration is not available under the AWS integration settings in Fleet > Agent policies. However, if the data is stored in S3 or CloudWatch, it can be ingested using the Custom AWS Logs integration. Note that custom ingest pipelines may be required for parsing the data accordingly.
As we need more context, submit an SR for the StackOps team to investigate and resolve this issue.
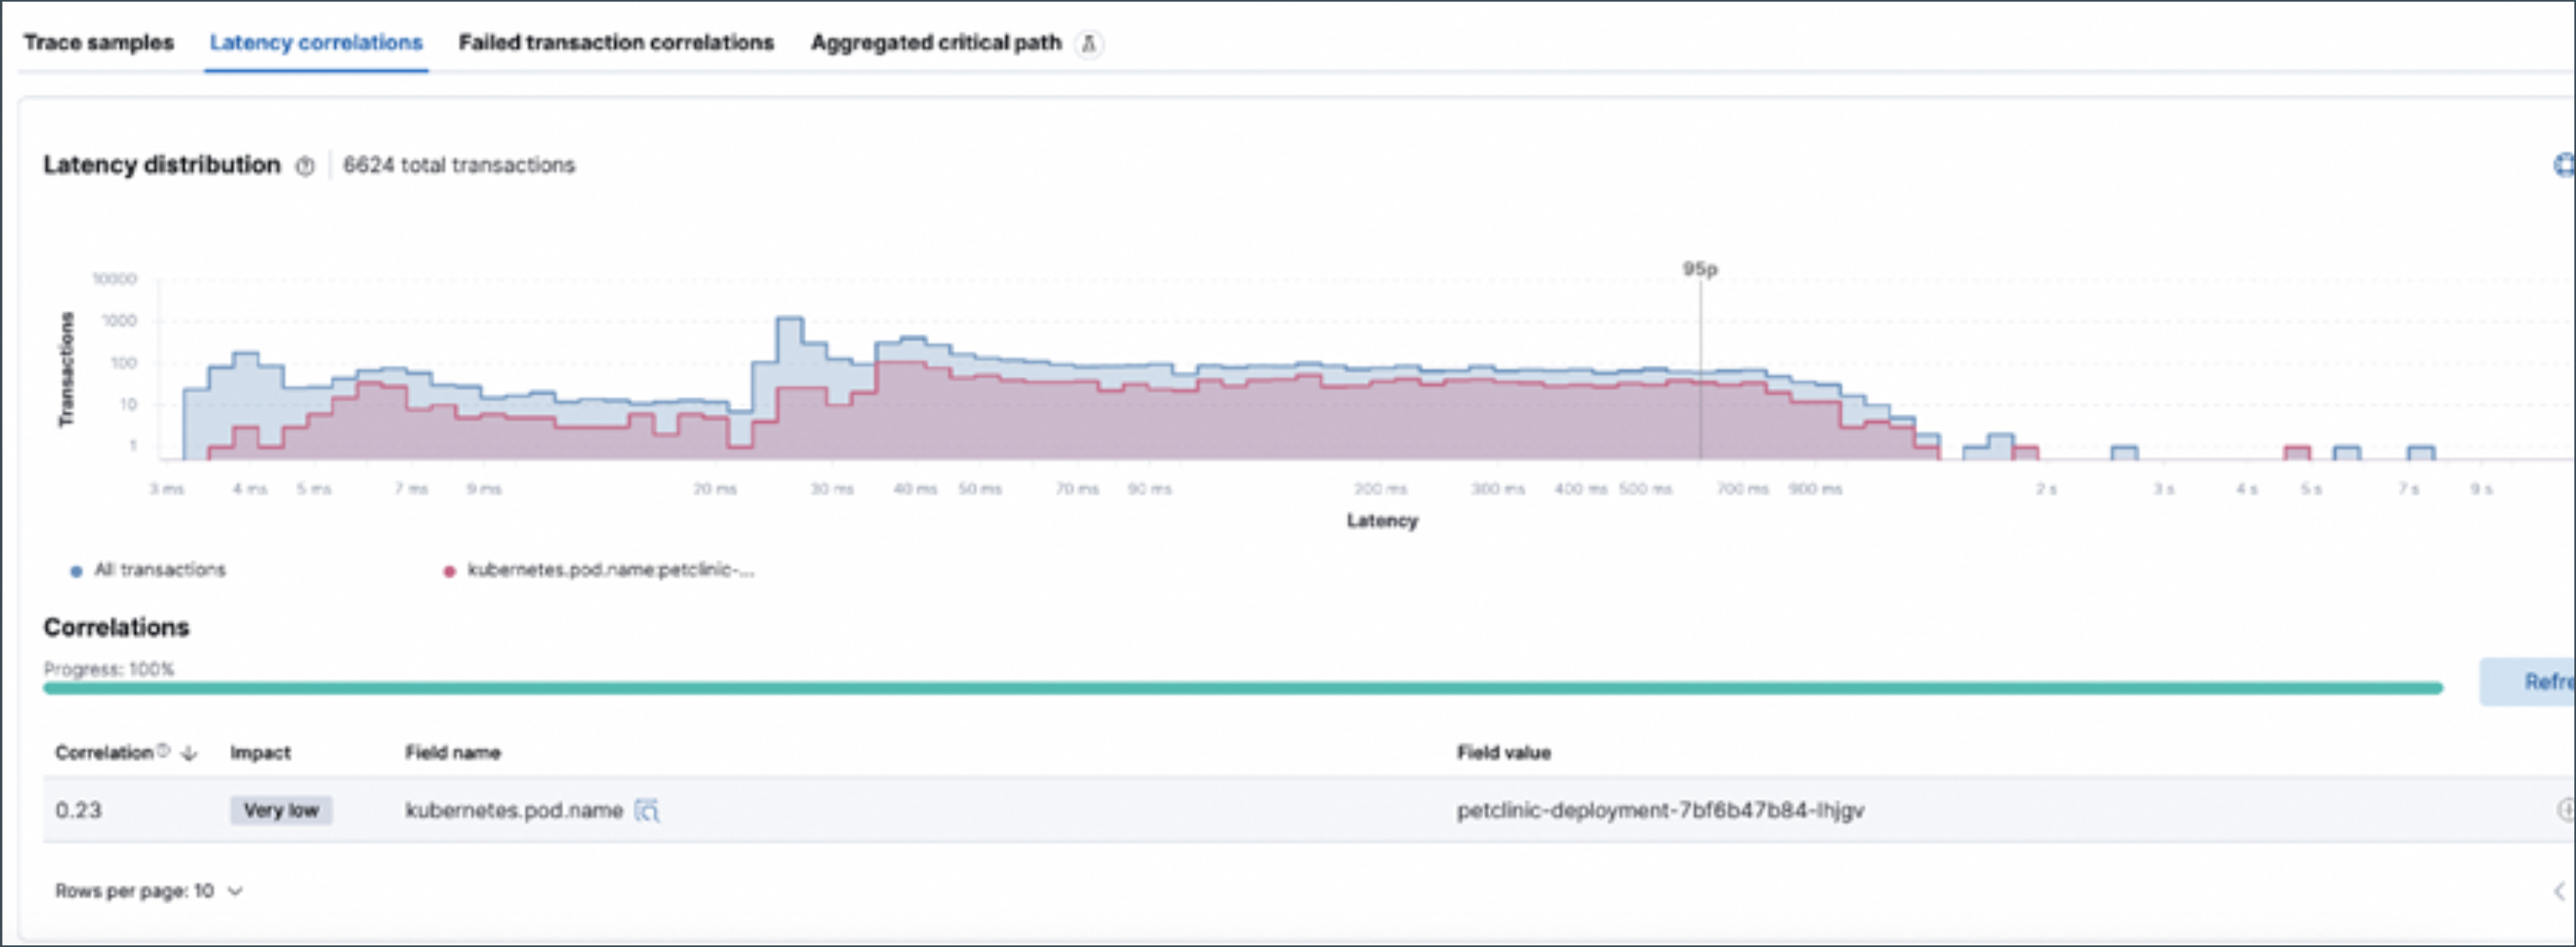
If we’ve set up an SLO using APM latency and the target SLO has been breached, we can utilize APM’s built-in latency correlation feature to identify which components in the service are causing the breach.
Create a transform job to perform percentile aggregation of transaction.duration.us field. The output of this transform job is the input for custom metric SLO. Refer to SLO configuration for detailed instructions on setting up custom metrics and percentile aggregation
For synthetic monitoring, we recommend using the GitOps methodology. Note that, currently, Alerts, SLOs, and Dashboards do not support GitOps. Automation for these components can still be achieved through APIs using Infrastructure as Code (IaC).