Relationships
Synthetic data involves a natural balance between data quality and privacy protection. Datasets that more closely reflect the original data may offer greater analytical value, while also requiring careful consideration of privacy risks. As a result, not every data quality metric will (or should) match perfectly.
Column relationships help you check whether the way different columns relate to each other in the real data is still reflected in the synthetic data. They show whether important patterns across columns are preserved, not just the columns on their own.
For Relationships, what counts as a “good” value depends on your use case. Prioritize evaluating and improving key relationships between variables that support your objective, rather than all pairwise relationships. For example, the relationship between Age and Medisave Usage might be more important than between Weather and Medisave Usage in a healthcare utilization prediction task. Find out more about how to improve the quality of the data generated here.
You can assess relationships using the following metrics:
- Correlation Scores
- Show whether columns that move together in the real data behave similarly in the synthetic data.
- Example: In the real data, as age increases, treatment costs generally increase too. A high correlation score between "Age" and "Cost" means this upward trend still appears in the synthetic data.
- Contingency Similarity Scores
- Show whether common combinations of values across columns appear with similar frequency in the synthetic data.
- Example: In the real data, a large proportion of patients with Diagnosis = Diabetes also have Medication = Insulin. A high contingency similarity score means this specific pairing occurs just as often in the synthetic data.
Correlation Scores
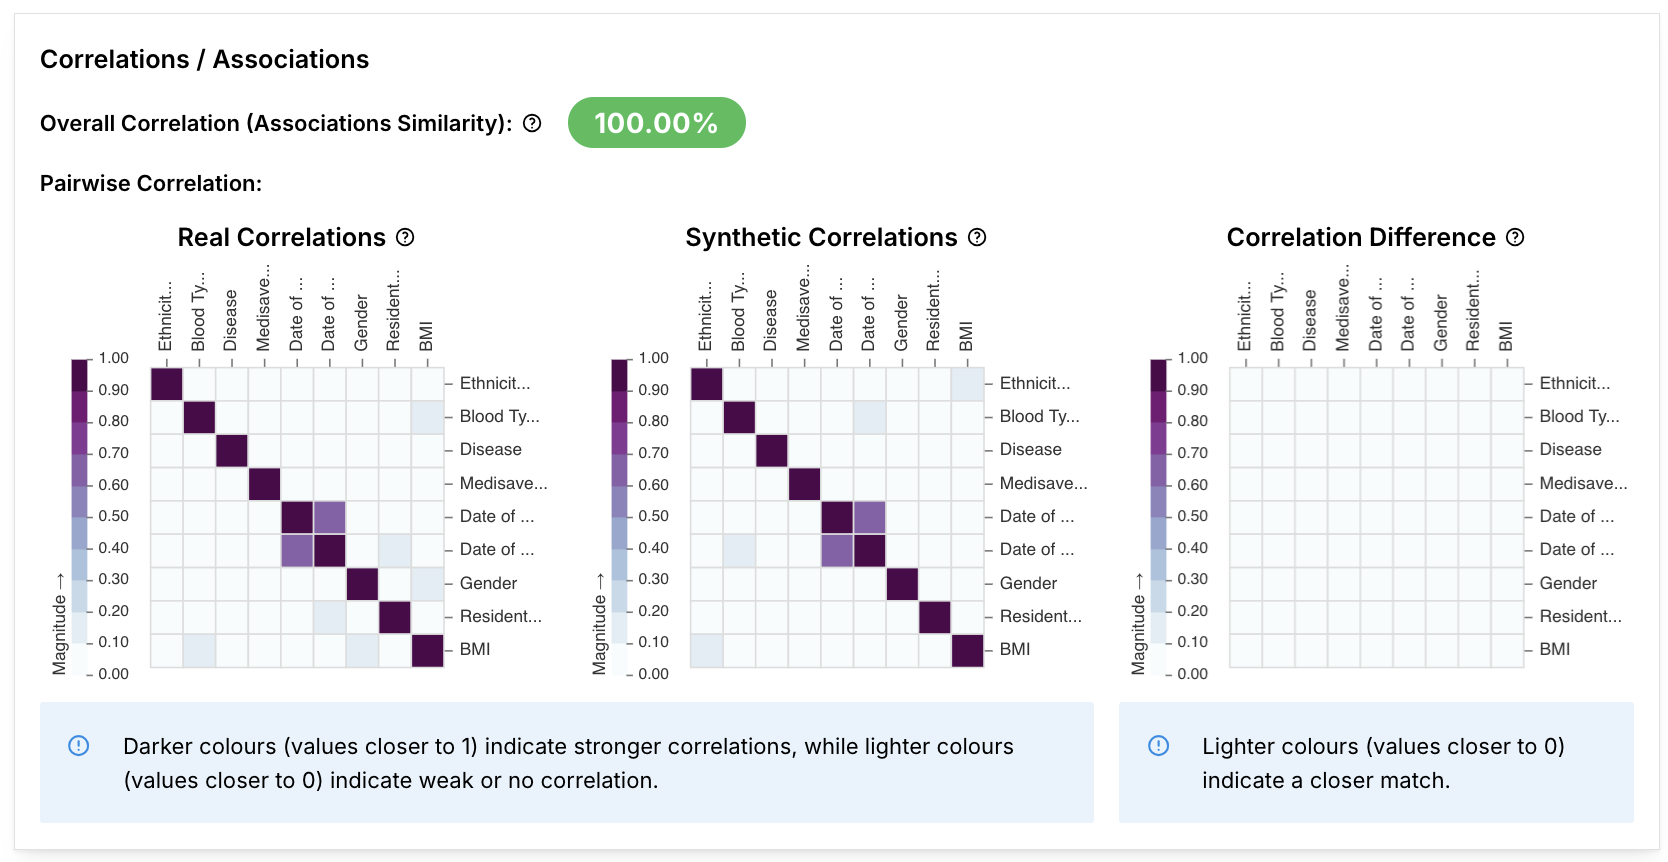
A synthetic dataset accurately replicates the real data when the correlation matrices for both datasets are similar. For example, If the real dataset has a negative correlation score between columns A and B, the synthetic dataset should also have a negative correlation score between the same columns.
Overall correlation
The “good” value depends on your use case. Synthetic data will never be a perfect replica, so focus on what matters most. For columns or use cases (e.g. data augmentation for machine learning) where retention of statistical attributes is important, you may require higher scores; if not lower scores may be acceptable.
The Overall Correlation (Associations Similarity) measures the overall preservation of column relationships in the synthetic data compared to the real data, taking into account all column correlations at once. Higher values indicate better overall preservation of relationships.
Overall Correlation (Associations Similarity)
Are the relationships between columns preserved? This is a combined summary of all the column relationships.
For example, if older patients in the real data generally have higher treatment costs, a low correlation score would indicate that this trend is weakened or missing, even if individual records still look plausible.
Multivariate Distribution Similarity (Find out more)
Does the overall shape of the data as a whole look the same? This measures how similar the overall multi-column patterns in the synthetic data are compared to the real data, considering all columns together rather than pair by pair.
Example: A low score may indicate records that look unrealistic as a whole, such as a 20-year-old patient with very high treatment costs and many hospital visits. These are values that may be possible individually but rarely occur together in the real data.
Pairwise correlation heatmaps
In the “Real Correlations” and “Synthetic Correlations” heatmaps, darker purple colours indicate higher correlation between the 2 columns within that dataset.
In the “Correlation Difference” heatmap, lighter grey colours indicate a smaller correlation difference between the real and synthetic datasets, and the synthetic dataset better reflects real dataset column correlations.
The actual correlation scores between columns for real and synthetic datasets can be viewed in the real and synthetic correlation heatmap:
| Correlation score | Definition | Example |
|---|---|---|
| 1 | The two columns are perfectly positively correlated. | When the values in column A increase, the values in column B also increase. |
| 0 | The two columns are not correlated. | Changes in values in column A do not occur at the same time as changes in values in column B. |
| -1 | The two columns are perfectly negatively correlated. | When the values in column A increase, the values in column B decrease. |
Calculation methods
Pairwise correlations between columns that have different types are calculated with the following metrics:
| Column types | Metric | Definition | Range |
|---|---|---|---|
| 2 categorical columns | Correlation Ratio | Correlation ratio is the ratio of the standard deviations of each category between the two columns. | [0, 1] |
| 2 numerical columns | Pearson’s R | Pearson’s R is a measure that measures the linear correlation between the two columns. | [-1, 1] |
| A categorical and numerical column | Cramer’s V | Cramer’s V is based on the chi-squared test, which determines whether there is a statistically significant difference between the frequencies of categories within each of the columns. | [0, 1] |
Datetime column values are converted into seconds (integers) before the correlation score is calculated.
Improving correlation score similarities
The correlation matrices of the real and synthetic datasets may differ in the following ways:
| Correlation difference heatmap description | Description | Potential cause | Solution(s) |
|---|---|---|---|
| Mostly lighter grey cells. | Similar correlation score matrices. | NA | NA |
| A mix of purple and grey cells. | The synthetic correlation score matrix identifies correlations between columns, but the correlations identified in the synthetic dataset are noisy and do not resemble correlations in the real dataset. | This could be due to the model not being sufficiently trained, as key relationships have not been learnt well. | Adjust the model hyperparameters and retrain the model. |
| Mostly darker purple cells. | The synthetic correlation score matrix does not identify correlations between columns. | This could be due to unsuitable model selection, or having a small real dataset. | Switch to a model that better captures relationships between columns, such as Gaussian Copula. Increase the size of your training dataset by:
|
Contingency similarity scores

A contingency table shows how often category combinations appear in two columns of real and synthetic data. This metric checks the similarity of these combinations (like “Male and Yes” or “Female and No”) to see if relationships are preserved. A high score means the synthetic data closely matches the real data.
Values
| Correlation score | Definition | Explanation | Example |
|---|---|---|---|
| 1 | The contingency table is exactly the same between the real and synthetic data | The frequency of column value pairs across all columns is exactly the same. | If both datasets have 100 rows, the pair “Male + Yes” appears 40 times in each, “Female + No” appears 60 times in each. |
| 0 | The contingency table is completely different between the real and synthetic data | The frequency of column value pairs across all columns is completely different. | In the real dataset (100 rows), “Male + Yes” appears 100 times and “Male + No” never appears. In the synthetic dataset, the opposite is true: “Male + No” appears 100 times, “Male + Yes” never appears. |
Sources: