Quarterly and Yearly dashboards
The Quarterly and Yearly dashboards provide a less granular, long-term overview of API requests.
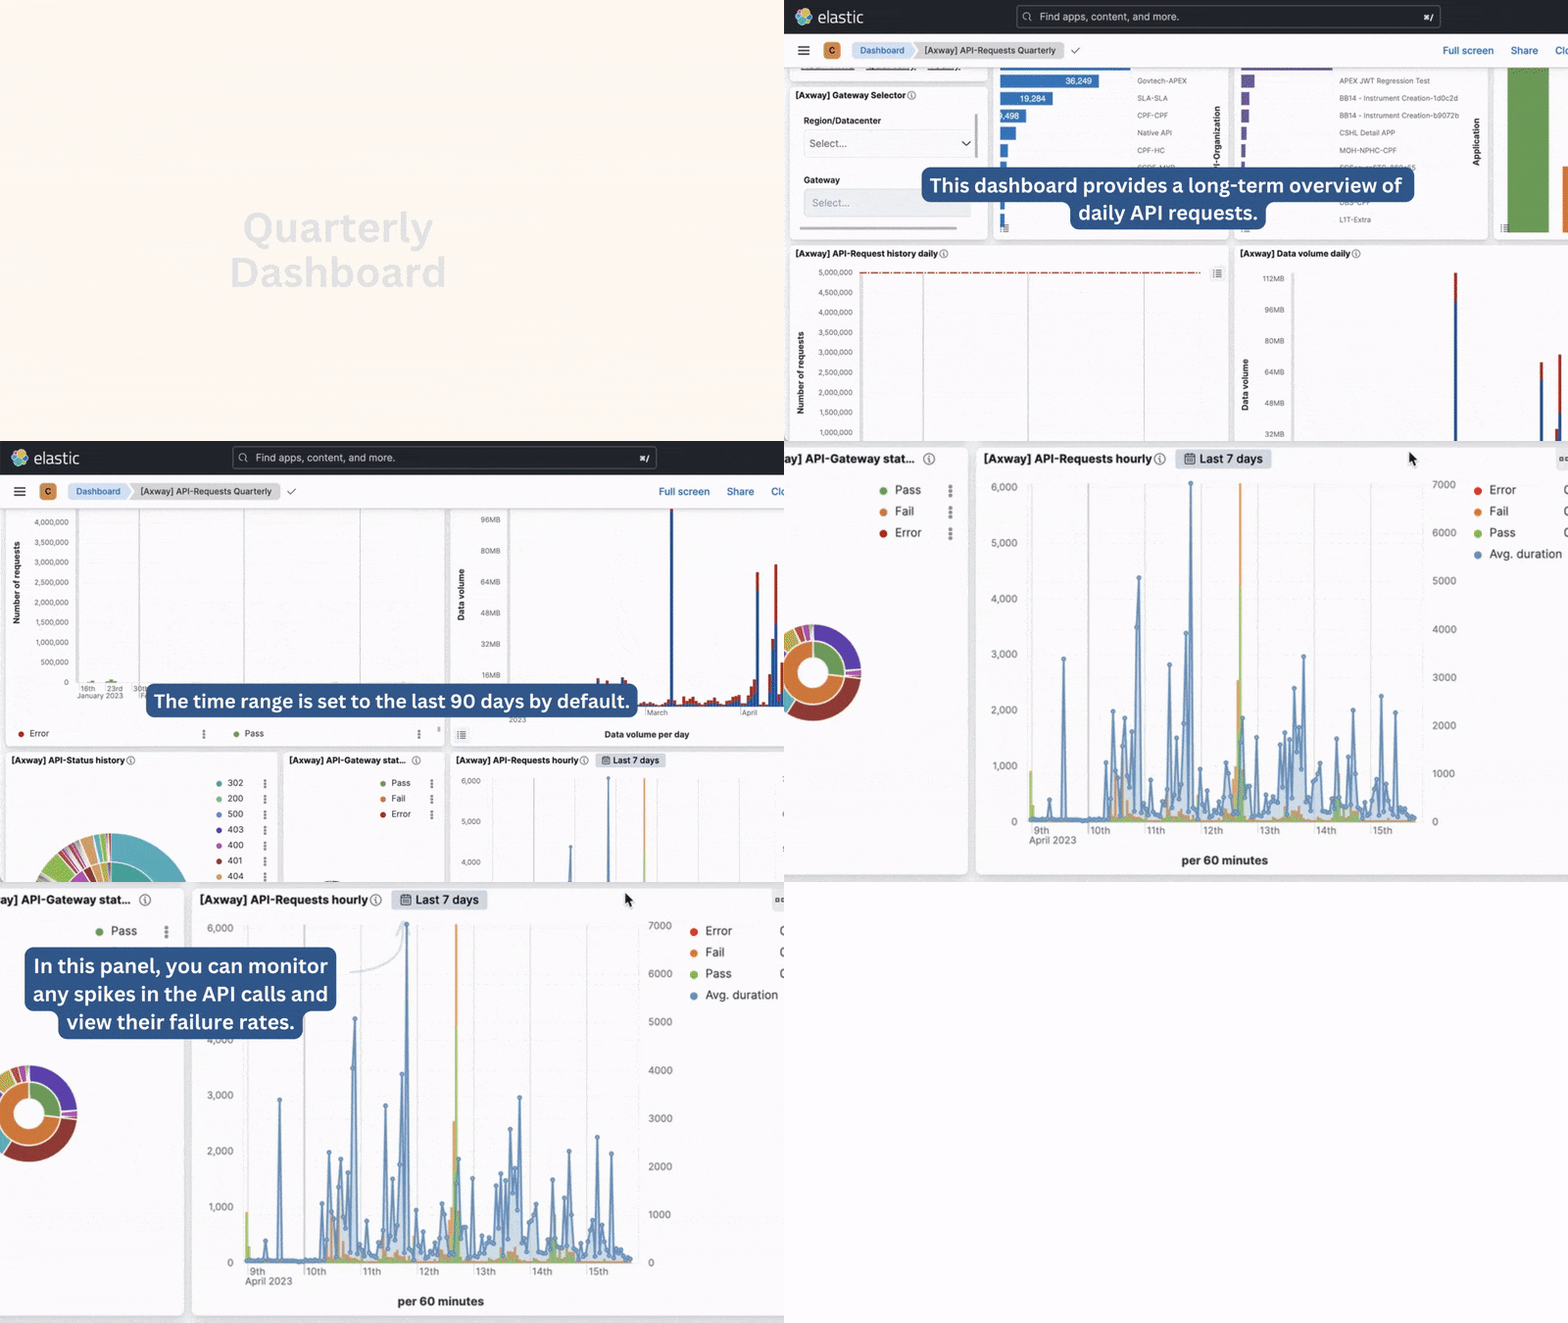
For the Quarterly dashboard, the default time range is set to the last 90 days. For the Yearly dashboard, the default time range is set to the last 1 year.
Note: Data appears with a delay of 3 hours.
These dashboards include the following panels:
- Top 10 API Organizations
- Top 10 Applications
- Request status
- Gateway Selector
- API-Request history daily
- Data volume daily
- API-Status history
- API-Gateway status history
- API-Requests hourly
- Top 500 API-Requests
- Top 500 Applications
- Status by API historical