StackOps Elastic Serverless architecture
StackOps Elastic enables agencies to monitor their systems regardless of where they reside, Government on Commercial Cloud (GCC) or on-premise. Learn more about the connectivity patterns, monitoring components, storage layers, and other key architectural elements for both cloud and on-premise setups.
Reference architecture diagram
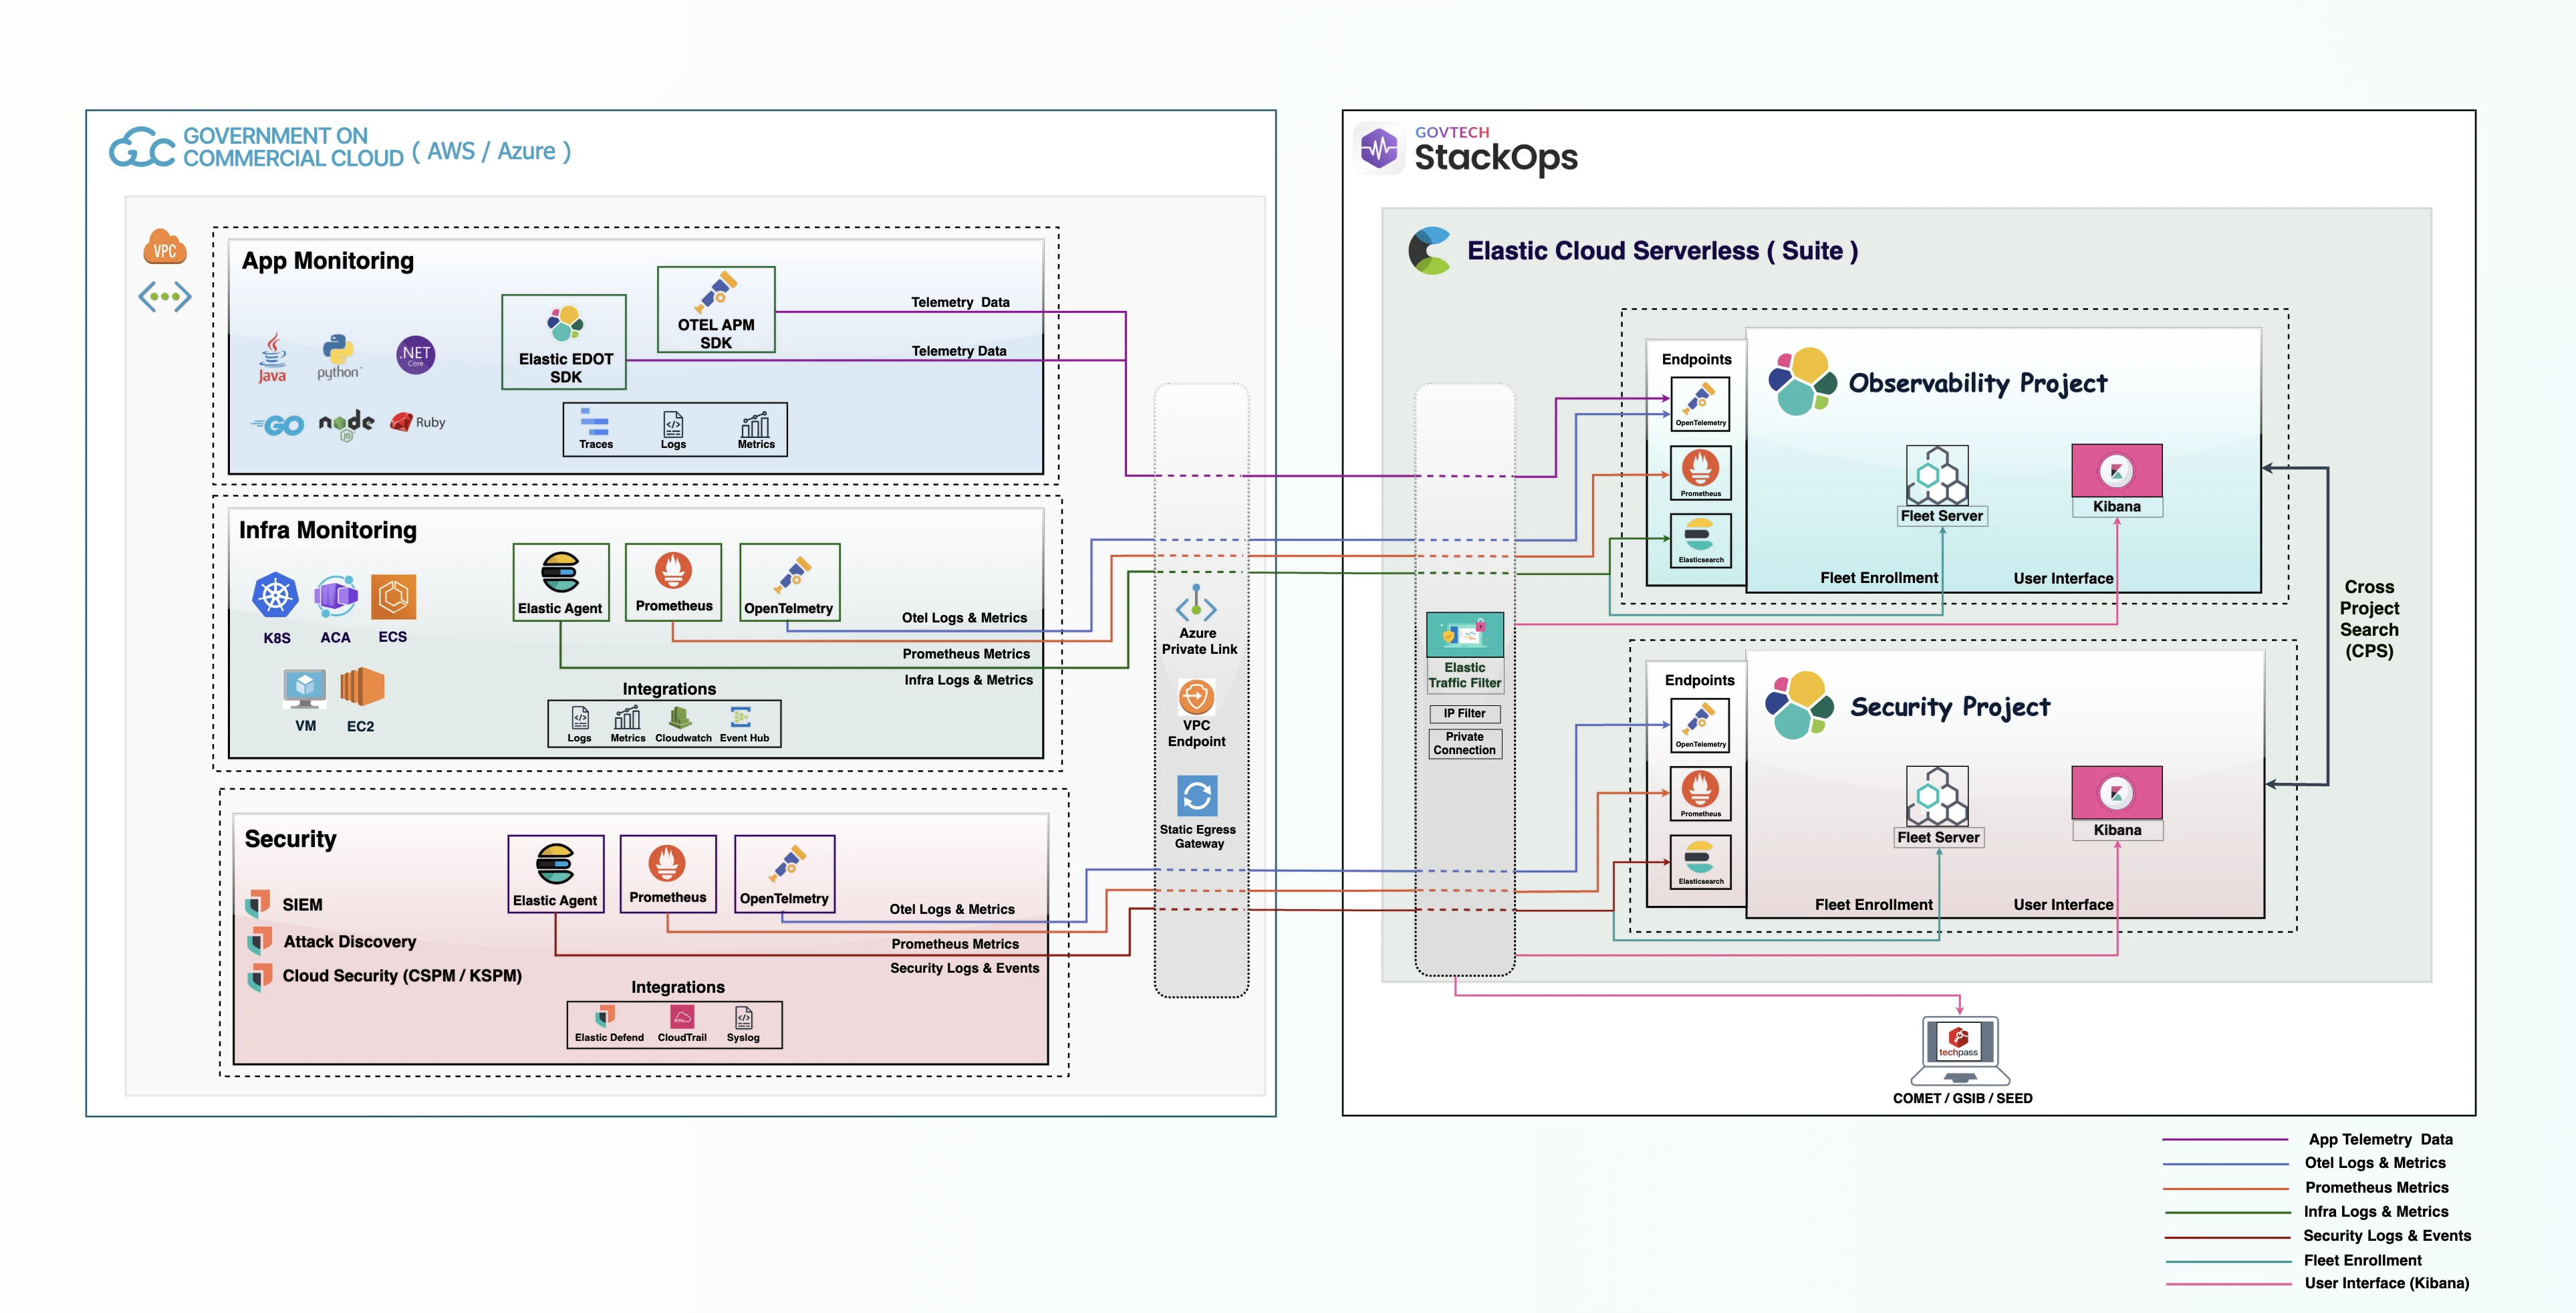
The following reference diagram outlines how telemetry data (logs, metrics, traces) is collected from the tenant’s environment, securely transmitted, and processed within the StackOps Elastic platform for monitoring and analysis.
The StackOps Elastic Serverless (Cloud) diagram illustrates two primary zones. The left zone represents the tenant’s workload hosted in GCC (AWS or Azure), where telemetry data originates. The right zone represents the StackOps Elastic Cloud Serverless platform, where data is ingested, stored, analysed, and visualised.
Cloud connectivity pattern
The monitoring data (logs, metrics, and traces) is securely routed to the StackOps Elastic deployment via private endpoints (AWS VPC Endpoint, Azure Private Link) or a Static Egress Gateway. On the receiving end, Elastic Traffic Filters enforce strict access control, ensuring that data is accepted only from whitelisted sources.
Tenant’s workload
The agency workload environment within GCC (hosted on either AWS or Azure) is the primary origin point for all telemetry data flowing into StackOps Elastic Serverless.
Telemetry data collection is categorised around three distinct monitoring domains: App Monitoring, Infra Monitoring, and Security, each targeting a different layer of the technology stack. This separation allows agencies to adopt StackOps incrementally — an agency may begin with infrastructure monitoring alone and progressively enable application performance monitoring and security analytics as requirements evolve.
App Monitoring
App Monitoring provides visibility into transactions, service dependencies, and code-level bottlenecks for microservices and monolithic applications. It supports multiple runtimes, including Java, Python, .NET, Go, Node.js, and Ruby.
Telemetry collection relies on OpenTelemetry APM SDKs and Elastic OpenTelemetry Distribution (EDOT) SDKs to capture distributed traces, runtime metrics, and application logs. The SDKs send telemetry directly to the Observability Project endpoints, enabling real-time observability.
Infra Monitoring
Infra Monitoring covers the availability, capacity, and resource utilisation of compute services and network logs. It targets Kubernetes (EKS & AKS), Container Apps (ACA & ECS), and virtual machines (Amazon EC2 & Azure Virtual Machines). Telemetry is collected using the Elastic Agent, Prometheus exporters, OpenTelemetry Collectors, and cloud-native streams such as AWS CloudWatch and Azure Event Hubs.
Agencies can route their data based on their primary focus:
- For application reliability and service performance: Send to the Observability Project to correlate service degradations with host and container health alongside application metrics and traces in a unified operational dashboard.
- For threat detection, host audit trails, and security posture monitoring: Send to the Security Project to correlate host logs, process executions, and system events with security feeds (such as CloudTrail and audit logs) for SIEM correlation, audit tracking, and threat hunting.
Security
Security monitors the security health, compliance, and threat posture of the agency’s virtual machines, containers, and cloud control planes:
- Elastic Agent with Elastic Defend captures endpoint threats, anomalous processes, and suspicious access patterns in real time.
- Integrations ingest cloud audit streams (AWS CloudTrail, Syslog) to track user authentication and administrative changes.
- Automated CSPM and KSPM scans validate cloud and Kubernetes settings against security benchmarks.
The core security capabilities delivered through this domain:
- SIEM — Centralised log aggregation, rule-based correlation, and real-time alerting across security data sources.
- Attack Discovery — AI-assisted detection that surfaces threats,anomalous behaviour, and attack patterns that rule-based detection may miss.
- Cloud Security (CSPM/KSPM) — Cloud Security Posture Management (CSPM) and Kubernetes Security Posture Management (KSPM) evaluates AWS, Azure, and Kubernetes environments against benchmarks such as CIS, flagging misconfigurations and compliance drift.
StackOps Elastic Suite
StackOps Elastic runs on Elastic Cloud Serverless. When an agency subscribes, the Observability and Security projects are provisioned together as a StackOps Elastic Suite. Each suite also includes:
- Cross-Project Search (CPS): Enabled by default. Teams can query data across both projects without duplicating ingestion pipelines. For example, host logs routed to the Observability Project remain searchable from the Security Project during an investigation.
- Kibana and Fleet Server: Dedicated instances per project. Kibana is the workspace for analysing data, investigating alerts, and managing telemetry configurations, while Fleet Server manages telemetry agents.
Access control
- Data ingestion: Whitelisted AWS VPC Endpoints or Azure Private Link endpoints in Elastic traffic filters, configured through Console. Only approved private connections can send telemetry to the StackOps Elastic platform.
- Kibana: Authenticated through TechPass and restricted to authorised devices (COMET, GSIB, SEED). Elastic traffic filters allow connections only from approved devices.
Data storage
StackOps Elastic Cloud Serverless separates compute from storage, using cloud Object Storage as the data foundation:
- Indexing Tier: Receives telemetry from Elastic Agent, Prometheus, and OpenTelemetry, and writes it to the Index Store in Object Store.
- Search Tier: Reads from the same Object Store to run queries and load Kibana dashboards.
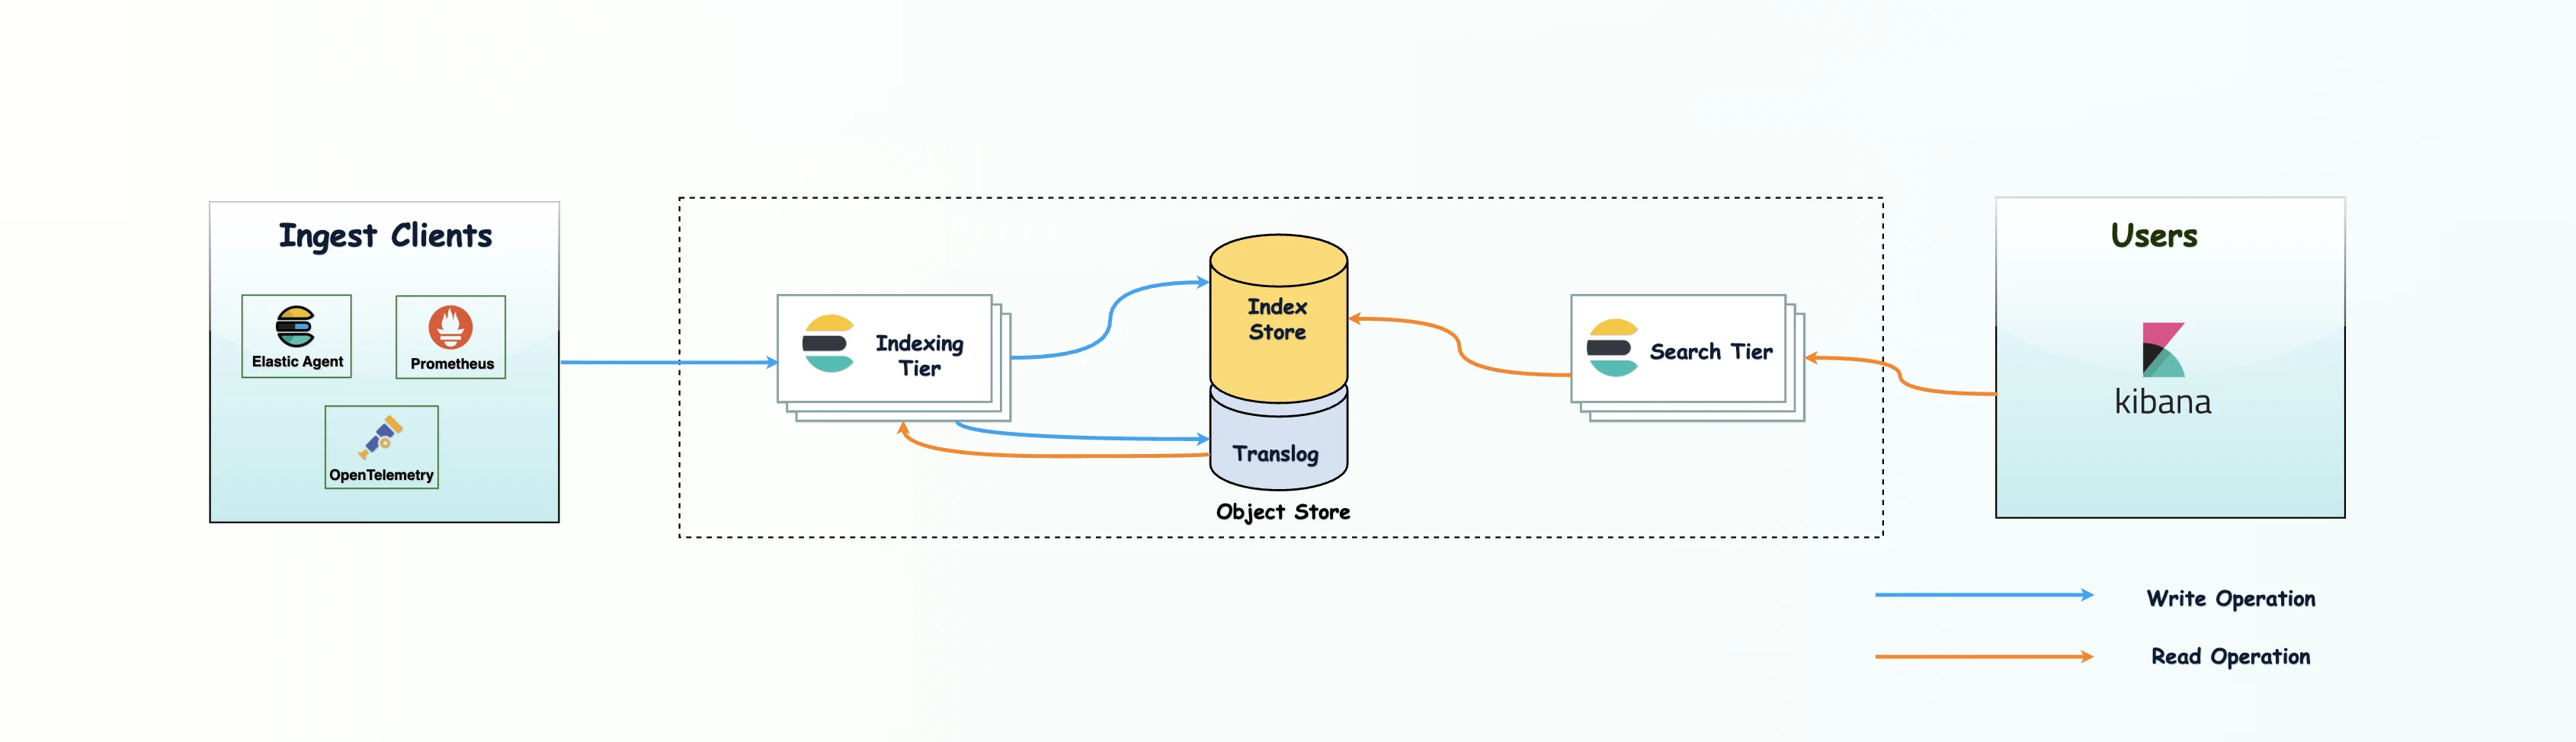
Because the tiers run on separate compute, resource-intensive dashboard queries do not impact ingestion speed, and telemetry surges do not affect search performance.